Server Monitoring System with SwarmSense
What is SwarmSense?
SwarmSense is a fully equipped IoT platform. With SwarmSense you can monitor any type of time-series data. Server metrics are also a time-series data so it is very easy to monitor your server stats with SwarmSense.
Steps:
- Create Sensor Type for servers
- Add your first sensor to monitor your server
- Add script on server to post metrics to SwarmSense
- Visualise your server metrics
- Add alerts to get notified on critical data
- Create dashboards
Create sensor type for server
Before sending data we have to create a sensor type which have required fields to monitor server metrics. So login with admin account and go to admin section. Now go to sensor types and create a new type.
First give it a name like: Linux Server
Now we have to add sensor fields. For this tutorial we are going to monitor following metrics:
- cpu_percent (Current system-wide CPU utilization as a percentage (1 second).)
- cpu_ctx_switches (Number of context switches since boot.)
- cpu_interrupts (Number of interrupts since boot.)
- memory_percent (System memory usage percent)
- swap_percent (Swap memory usage percent)
- disk_percent (Disk ‘/’ use percent)
- disk_read_count (Number of reads)
- disk_write_count (Number of writes)
- net_bytes_sent (Number of bytes sent)
- net_bytes_recv (Number of bytes received)
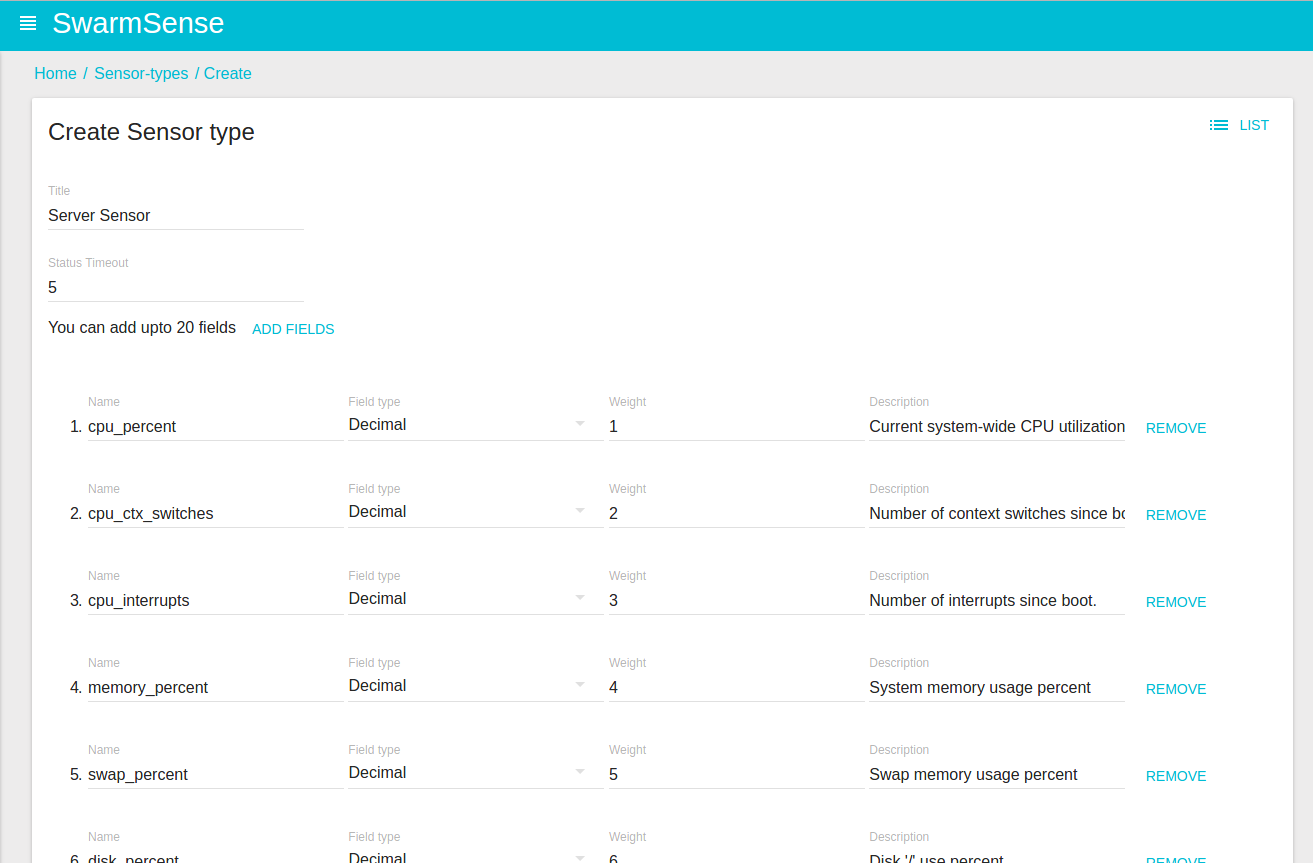
So create the above fields and save it.
Add your server sensor
Now we can create own sensors for this type.
Go to sensors and add a new sensor.
Give it a name (like: DO New Server) and select the sensor type that we created earlier in admin section. You can also give it a location on map. Now save the sensor. After successfully saving it you will get an id and a key. We will use these later to post the server stats to the sensor.
Sending data to SwarmSense
Now we have created our sensor, we have to send server metrics to SwarmSense. The endpoint to send values to SwarmSense :
/sensors/<sensor_id>/valuesHere is the python example script to send server metrics to SwarmSense.
#!/usr/bin/python3
import os
import requests
import psutil
import json

# Use your sensor's id and key.
SENSOR_ID = '<your sensor id>'
SENSOR_KEY = '<your sensor key>'
END_POINT = "http://127.0.0.1/api"

url = "{}/sensors/{}/values".format(END_POINT, SENSOR_ID)

cpu_stats = psutil.cpu_stats()
mem = psutil.virtual_memory()
swap = psutil.swap_memory()
disk = psutil.disk_usage('/')
disk_io = psutil.disk_io_counters()
net_io = psutil.net_io_counters()
min_1, min_5, min_15 = os.getloadavg()

payload = {
    "cpu_ctx_switches": cpu_stats.ctx_switches,
    "cpu_interrupts": cpu_stats.interrupts,
    "memory_percent": mem.percent,
    "swap_percent": swap.percent,
    "disk_percent": disk.percent,
    "disk_read_count": disk_io.read_count,
    "disk_write_count": disk_io.write_count,
    "net_bytes_sent": net_io.bytes_sent,
    "net_bytes_recv": net_io.bytes_recv,
    "cpu_percent": psutil.cpu_percent(interval=1),
    "load_avg_1": min_1,
    "load_avg_5": min_5,
}
print(payload)

headers = {
    'x-sensor-key': SENSOR_KEY,
    'content-type': "application/json",
}

response = requests.request("POST", url, data=json.dumps(payload), headers=headers)

print(response.text)
Copy the above script to a file server.py and run it. It will send your server metrics
to your SwarmSense server. To run it periodic you can add this to server’s cron tasks.
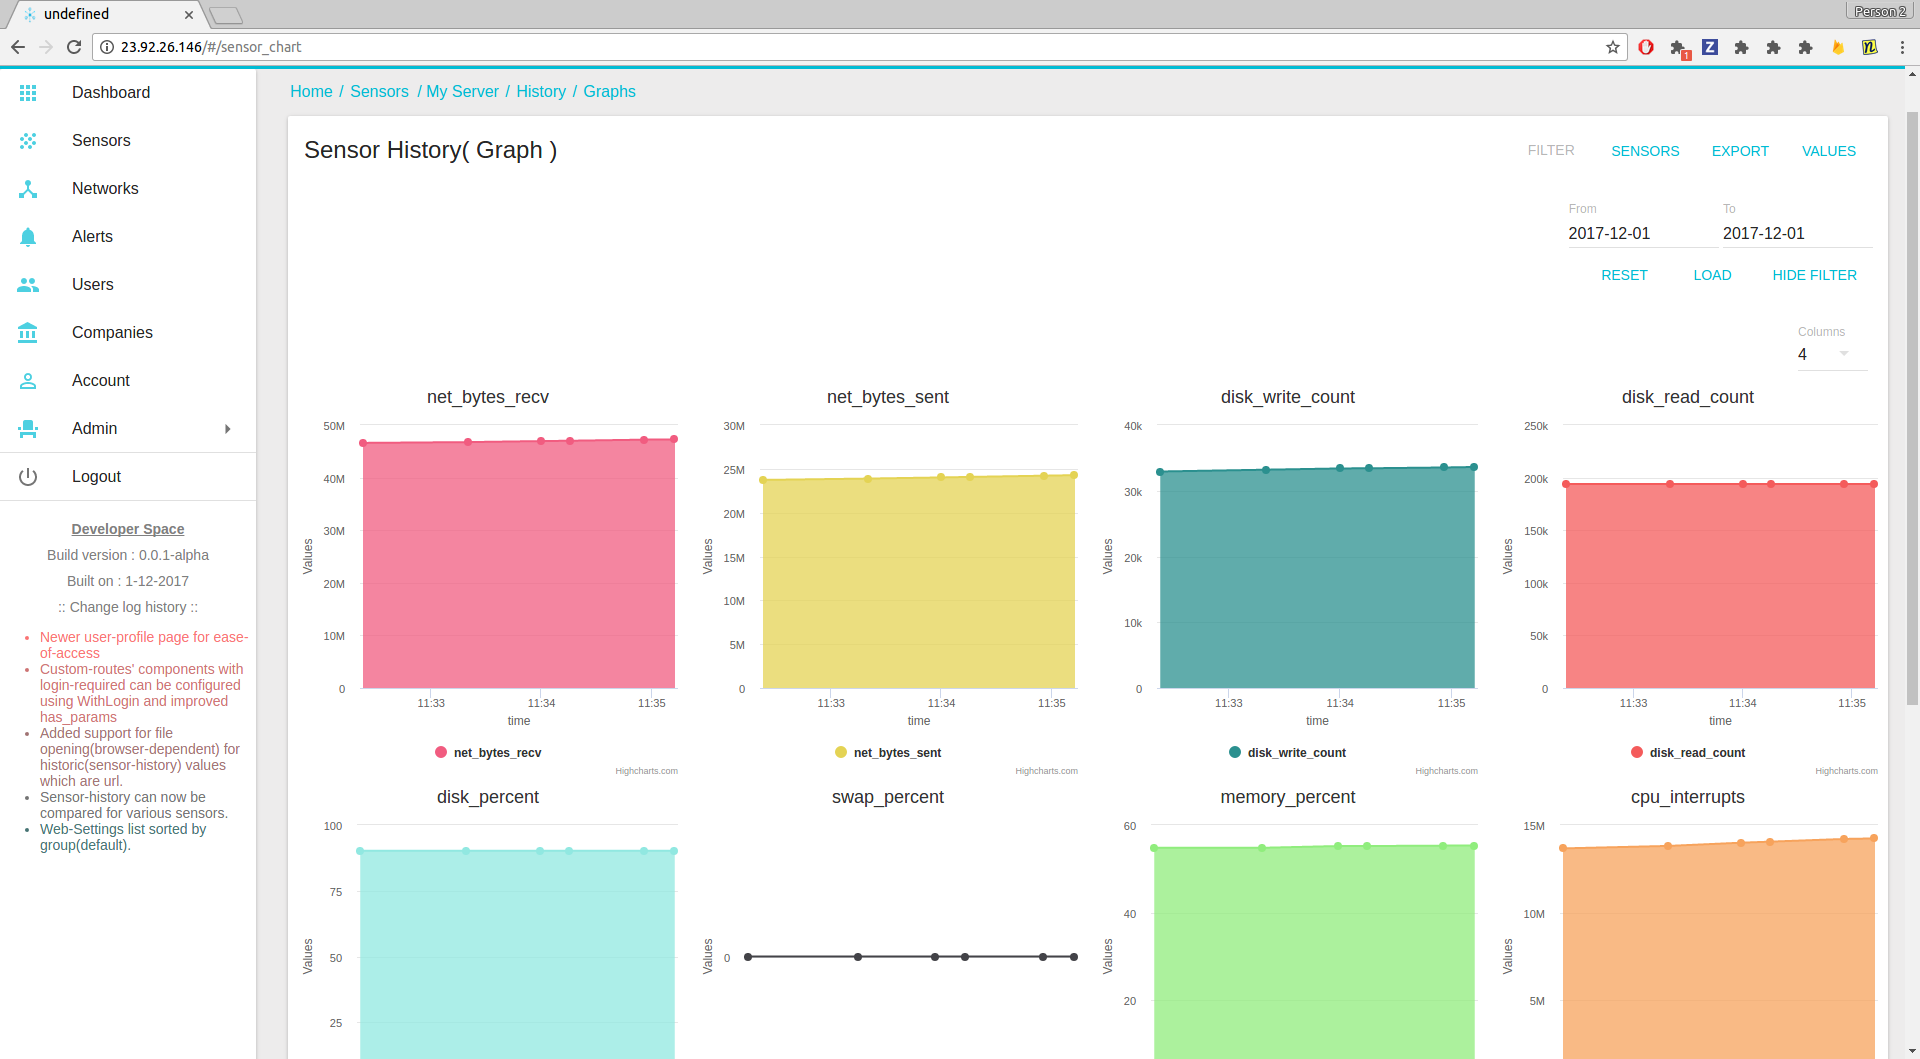
Visualise your server metrics
Since the above script is sending data to SwarmSense server, you can see the data with SwarmSense Web UI.
Go to the sensors and you will see latest sensor data in the list.
For detailed data click on sensor name. Here you can see the sensor history and graphical data.
Setup Alerts/Notifications
Since our first sensor is ready and sending data to our SwarmSense server, we will now create an alert trigger for disk uses so whenever disk use is more then 90% we will get an email notification.
To create a alert go to Alerts section and click on Create button.
On create alert page select the sensor type Server Sensor for which we are going to create an alert.
Now select Field which you want to monitor. Now select Type of alert. Since we want alert if disk use is more then 90%, we will select Greater Than in type.
Now enter the Value to compare with. Here it is 90.
Give a name to the alert and provide the Alert Text. This alert text will be send to you in email message. There are some template variables that you can use in alert text. Checkout Variables to use in email templates
Now mark it as active and add snooze time.
For the recipients add a comma separated list of emails. You can also add web-hooks for third party integration.
Now select Start time and End time duration for which you want to run the alert.
Now save it. You alert is ready. Now you have to attach this alert to your sensor. So go to the sensors page. Click on edit button of your sensor. On the edit page click on the Alerts on top. This will show all the alerts attached to this sensor. Now click on Create button. Select the alert type that we just created and save it. Its done.
Now you will get an email alert on low disk space.
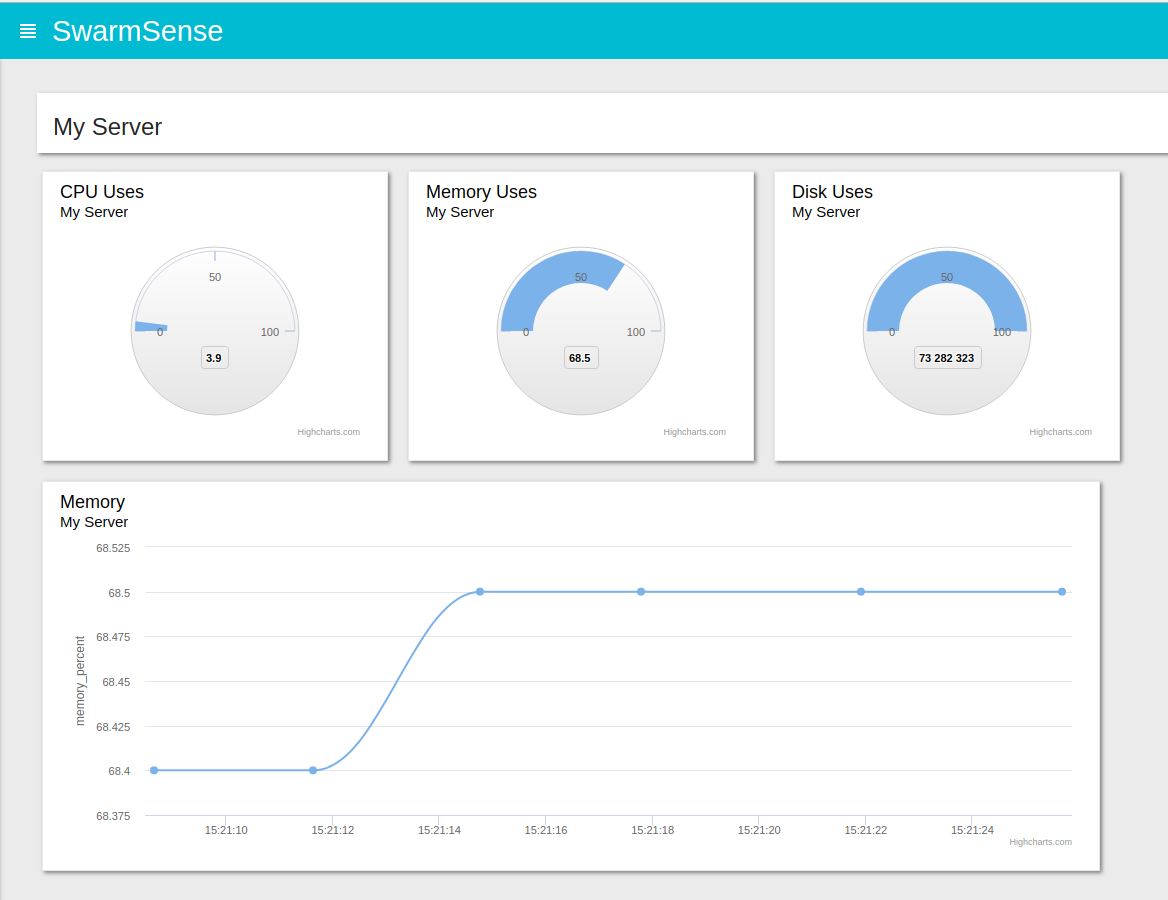
Create Dashboards
Now our sensor is ready and we are monitoring our first server, it’s time to create dashboards to visualise our first server’s stats. Creating a dashboard is really easy with SwarmSense.
Go to dashboards and click on create button. Give it a name and save it. After saving, it will be listed in your dashboards.
Now go to this new dashboard. Right now it’s empty so we have to add widgets for our server sensor. Click on edit and then add widget button.
Enter widget name, select widget type. There are many types of widget like graph, gauge, map etc. For our server sensor we are going to use gauge and graph widgets. So select your widget type then the sensor. After selecting sensor it will ask for the field whose data we want to show in widget, so select a field. You can set the size of widget by selecting appropriate width and height. Now save it and your first widget is ready.
The dashboard will show realtime data so you don’t need to reload the page every time.